Posts

Showing posts from October, 2017

Data Search - Weeks 7&8 Lab/Midterm

Image
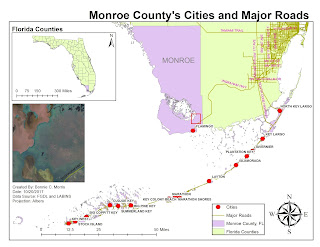
In weeks 7-8 we combined concepts learned up to this point to create maps with many key features including: Cities & towns, major waters, public lands, As expected, this lab/midterm was the most challenging and time consuming yet, but I realized how much I have learned since day one - a lot. The most challenging part of this lab to me was finding an appropriate vector layer for each field and overcoming lag and errors within the ArcGIS software. Previously, the directions have been pretty straight forward, but when allowed a lot of room for creativity, I recognized that ArcGIS is not very accommodating to trial and error. The main concern I had about this lab was that clipping the DEM and roads to the layer of Monroe County caused it to look splotchy and unfinished. I felt this took away from the purpose of the maps, so I left the other counties in and did the best job I could to make Monroe County stand out. I decided to include my process summary again this week because it ex

Projections 2 - Week 6 Lab

Image
In this lab we got even more familiar with projections. I feel it was the most user-intensive lab yet and took a very long time, but I definitely feel more comfortable with the material after completing it. First we downloaded most of the information we would need for parts 1 and 2 online. This included aerial photos, topographic quadrangles, and shapefiles. Then we inserted this information into our map. We were required to define a spatial reference for some of the files as well as project some of the files to make sure all the files were using the same projection. Then we modified an excel file with formulas to create x and y columns, inserted the file in .xls format onto the map and displayed the data using longitude and latitude. We converted this X,Y file into a shape file and projected it onto the State Plane projection. At the end of part 2, all of our layers were on the same projection except the aerial photos. Part 2 - Step 4 A problem I ran into during an ea

Projections - Week 5 Lab

Image
This week we learned the difference between projections and how they are affected by location. We also learned that layers with the same projection should be used together or the locations will most likely be wrong.  My favorite part of this lab was recognizing how much variation can occur between different projections and projection types. It gives me a new perspective on the maps I read - there are many intricacies that go into how an area of land is measured and the slightest oversight can yield inaccurate results. It is also nice to know that GIS is able to display these measurements electronically which makes the information easier to obtain and compare.   Issues: I wasn't sure if I should put the measurements in the legend as well since this is how it was in the example. I feel that having the measurements on both the table and legend is a little redundant, but it is easy to follow.