Posts

Final

Image

Module 10 - Supervised Classification

Image
Exercise 4 required me to combine the skills I learned in the previous exercises to create a map detailing the land use for an area in Germantown, Maryland. To create this map, I needed to go back through each of the previous steps to choose the best course of action for this type of map. I created classes for each of the different land uses, addressed any spectral confusion, and then consolidated like-classes. I chose colors for each class that stood out from each other. Finally I opened my map in arcpro, added essential elements, and exported my map.

Module 9 - Unsupervised Classification

Image
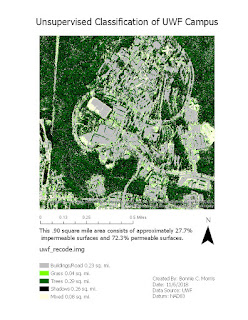
In exercise 2, I used ERDAS imagine to manually separate a high resolution aerial image of the UWF campus into classes. Initially, I created 50 classes with the Unsupervised Classification function so that there would be enough classes to clearly translate the image and then consolidated those classes into 5 independent (including mixed) classes using the “Recode” function. I chose to turn the original layer on and off while classifying the image instead of the swipe, flicker, or blend methods, as this was the easiest for me. I did the math to determine how much of the area was permeable an impermeable and wrote the percentages on the map. Towards the end of my map creation, while working in layout view, I ran into the familiar problem of the cursor getting stuck on the rotate function. I restarted Argo Apps several times to fix this issue. 

Module 8 - Thermal & Multispectral Analysis

Image
In exercise 4, I picked an area of the map that I found particularly interesting, which is an island in the river. I picked my favorite band combination/setting and then explained in the map notes why I made these decisions.

Module 7

Image
In exercise 5, I put many of the skills I had learned together to create deliverable maps that identified certain features that represented variations in the histogram. I thought it was interesting to change band combinations and colors to determine what the features were and enjoyed using my best judgment to represent the data. I did most of my adjustments in arc maps after using the subset and chip tool to choose the most representative part of the map in arc pro. The only problem I had was with my cursor defaulting to the pan and rotate tools, as it has before in ArcPRO, which necessitated me logging out and back into argo apps several times.

Module 6 - Spatial Enhanceme

Image
I created a map deliverable that utilized the best method of reducing visibility of the lines I could find. I tried many different types of kernel filters and determined that a 3x3 high pass filter looked the best to me. I also tried edge detect, edge enhance, other sharpen filters, and running the fourier transformation again on the fourier1.img layer, but none of the enhancements made the image as clear. I also attempted to create a custom kernel like the example, but I was unable to run this successfully.

Module 5b - Intro to ERDAS Imagine and Digital Data

There was not a map deliverable for this lab, but in exercise 4  we created a map that showed the percent area of the most erosive soils. This exercise reminded me of previous tasks I have completed with ArcMap, but it seemed to be an easier process. I can appreciate how this function will be useful for many different data types including stand type, population density, and other trends that can be uncovered by using formulas to select specific characteristics.