Posts

Module 7 Lab: Choropleth & Proportional Symbol Mapping

Image
This week, we were instructed to create a choropleth map that compares population density to wine consumption in Europe. A choropleth map is a map with shaded areas that are representative of a variable being displayed on the map. This map was fun to make because it was based off of skills we learned last week, but introduced new functions in ArcMap that I will definitely use in the future. The data did not need to be normalized because it displays population density for each country, which can be accurately compared.  The first stages of map creation included adding the provided European countries file to the table of contents. From there I had to decide which classification method to use for the population density. This was, in my opinion, the trickiest part of this map because such a major part of the map presentation was left up to our own judgement. After cycling through the methods to see how many classes they created and how well the data was presented several times, I ...
Module 6 Lab: Data Classification

Image
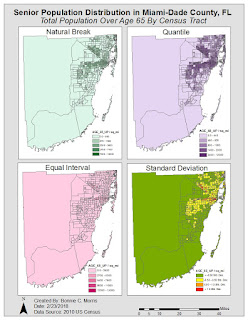
Module 6 was another very informative lab. The requirement was not too intense, but understanding the material required thorough study of the textbook chapters and lecture. We were instructed to make two maps of seniors (people over age 65) in Miami-Dade County, FL using four different classification methods: Equal Interval, Quantile, Standard Deviation, and Natural Break. One map used the percentage of seniors by census tract and the other used the total number of seniors by census tract. Since I knew that the color ramp would need to be changed for standard deviation and because one of the "good example" maps I chose in the first module used this approach, I decided to use different colors for each classification method. In my opinion, this added an additional level of clarity to the map, without taking away from its purpose. The four classification methods I used are defined below. For each, I'll start out with a description in my own words from my process summary...

Module 5 Lab: Spatial Statistics

Image
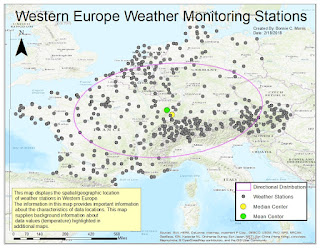
This week we used ESRI training online to learn more about the relationship data location and quantity have with the nature of the information we present in maps. The map below is part of the first exercise. In this section, we were asked to explore spatial patterns in the data using ArcGis. By implementing the provided map and data, I was able to determine directional distribution, median center, and mean center of weather monitoring stations. Knowing where these stations are located and  the trends associated provides more insight to the values they provide.  The mean of these stations shows that while there are clusters of stations located in Switzerland and Austria, the dispersed stations in northern and western regions keeps the mean in the center of western and central Europe.  Likewise, the median is still located towards the center despite the clusters, but it is more influenced by them than the mean.  The directional deviation shows that the ecl...

Module 4 Lab: Cartographic Design

Image
This week, we were asked to create a map that employed features that provide the maximum amount of legibility and clarity. Using Gestalt principles of perpetual organization, I was able to create a map that highlighted schools in Washington D.C. and separated them by elementary, middle, and high schools. Contrast: I used contrast to differentiate the schools by color and size Visual Hierarchy:  To implement visual hierarchy in my map, I ensured that the focal area, Ward 7, was the main point of the map by making it a lighter color than its surroundings and its features more prominent than those in other areas. Next, I made the title, subtitle, and legend the second most important features on the map by their locations, colors, and size. The scale and north arrow, data source, and frame and neatlines are the next most-relevant features, respectively. Figure-ground Relationship: To establish this, I made Ward 7 lighter than the other features on the map to make it appear c...

Module 3 Lab: Typography

Image
This weeks topic was typography. In our lab, we were asked to label cities and other prominent features of Marathon, Florida. The first step was creating a basemap on ArcMap that featured a small scale map of Marathon and an inset map that further explained its location. Next, we were instructed to import this into Adobe Illustrator as an AI file. While the lab required a little more knowledge of Adobe Illustrator, I found it much easier to complete and appreciated that confidence in my skills allowed me to experiment with the program and get the look I envisioned. Some features I added to my map were: Text halos, inset map and legend drop shadows, varying font colors and sizes, and two font families. While the map might look simple, it was necessary to closely study the text to understand the correct way to position, size, and implement certain map features as well as what fonts to use. I found it interesting that I followed most of the rules in my previous maps already. I attribut...

Module 2 Lab: Introduction to Graphic Design with Adobe Illustrator

Image
This week, we were expected to make a map on ArcMaps, save it as an AI file, and add design features with Adobe illustrator. The product we were asked to submit was pretty basic, but the learning curve with Adobe Illustrator was quite intense. The first step, creating a map with ArcMaps, was simple and straightforward to me. Unfortunately, after importing the map into Adobe Illustrator, I realized that there were a few compatibility issues. My north arrow was not visible and I needed to remove the mask from each of the layers on my original layer package and "Other 2". I have listed several other problems I encountered below. Hopefully, I will become less inept to dealing with these issues as I become more familiar with the program. Ultimately, I was able to change my city symbols and add the required text and images, but I still feel like I have a lot to learn about the software. Overall, I am very satisfied with the final map I created. I was unable to change the color...

Module 1 Lab: Map Critique

Image
This week was the first lab assignment for cartography. We were instructed to find an example of a "well done" map and a "poorly done" map from a variety of sources and recognize elements that we want to include and exclude from our aesthetic throughout our GIS careers. I really enjoyed looking through all the maps and appreciated how a story can be told with very few words. There were several maps that appealed to me, but I felt a lot of them omitted information that was necessary. For example, a global map of racial tolerance did not include country names or the majority race in each area, which seems necessary to communicate a point in my opinion.  The map I ultimately chose as my "well done" map is a map of the world's population concentrated in the United States based in the population density of major cities. This is very interesting to me because it gives one an idea of how crowded or spread out different cities are over a very familiar lan...