Module 5 Lab: Spatial Statistics
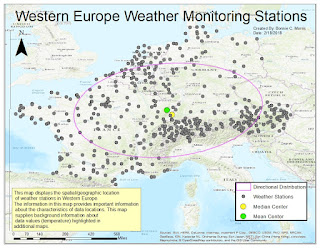
This week we used ESRI training online to learn more about the relationship data location and quantity have with the nature of the information we present in maps. The map below is part of the first exercise. In this section, we were asked to explore spatial patterns in the data using ArcGis. By implementing the provided map and data, I was able to determine directional distribution, median center, and mean center of weather monitoring stations. Knowing where these stations are located and the trends associated provides more insight to the values they provide.
The mean of these stations shows that while there are clusters of stations located in Switzerland and Austria, the dispersed stations in northern and western regions keeps the mean in the center of western and central Europe.
Likewise, the median is still located towards the center despite the clusters, but it is more influenced by them than the mean.
The directional deviation shows that the eclipse is roughly east-west in orientation.
This week was a very information-packed and data driven module. In addition to the topics discussed in the first exercise, we also learned about distribution, variation, patterns, and global trends in data.


Comments
Post a Comment