Posts

Module 2 Lab: Introduction to Graphic Design with Adobe Illustrator
Image
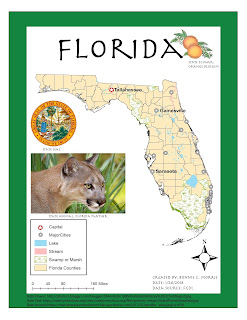
This week, we were expected to make a map on ArcMaps, save it as an AI file, and add design features with Adobe illustrator. The product we were asked to submit was pretty basic, but the learning curve with Adobe Illustrator was quite intense. The first step, creating a map with ArcMaps, was simple and straightforward to me. Unfortunately, after importing the map into Adobe Illustrator, I realized that there were a few compatibility issues. My north arrow was not visible and I needed to remove the mask from each of the layers on my original layer package and "Other 2". I have listed several other problems I encountered below. Hopefully, I will become less inept to dealing with these issues as I become more familiar with the program. Ultimately, I was able to change my city symbols and add the required text and images, but I still feel like I have a lot to learn about the software. Overall, I am very satisfied with the final map I created. I was unable to change the color...

Module 1 Lab: Map Critique

Image
This week was the first lab assignment for cartography. We were instructed to find an example of a "well done" map and a "poorly done" map from a variety of sources and recognize elements that we want to include and exclude from our aesthetic throughout our GIS careers. I really enjoyed looking through all the maps and appreciated how a story can be told with very few words. There were several maps that appealed to me, but I felt a lot of them omitted information that was necessary. For example, a global map of racial tolerance did not include country names or the majority race in each area, which seems necessary to communicate a point in my opinion.  The map I ultimately chose as my "well done" map is a map of the world's population concentrated in the United States based in the population density of major cities. This is very interesting to me because it gives one an idea of how crowded or spread out different cities are over a very familiar lan...

Welcome to GIS4006

Hello,  My name is Bonnie C. Morris and this is my first blog post of the new semester. I am looking forward to learning even more about GIS and becoming more confident in my skills.  I am from a small town in Georgia, but currently reside in Gainesville, Florida. I am a recent graduate of UF where I majored in Forest Resources and Conservation. I love technology and I chose to learn more about GIS because it combines two areas that I'm interested in. Like many of you, I hope to work in a field that allows me to contribute the knowledge I have gained from these courses. This is my second semester at UWF and so far I have learned a great deal. In my spare time I enjoy watching football and basketball. http://arcg.is/2mvSVsW

Final Project - Week 13 Lab

Image
This lab was our final project and took a total of three weeks to complete. While it was appropriately the most difficult and time consuming lab, I realized how much more effectively I could complete the required tasks vs. the earlier weeks, even though those labs required much less input. The lab was separated into four objectives and I decided to complete what I assumed was the most difficult portion first; objective 3. This section required downloading datasets from FGDL, which in previous labs has proven to be tedious at times. This case was no exception. I found data on both the number of daycares in Florida and the number of public and private schools in Florida, but when I opened the files on ArcGIS, I realized that the school shape file was in the form of polygons instead of points. However, I was able to obtain the required information from this polygon file so I left it as it was.  Another interesting interpretation I had with this objective was putting buffers ...

Georeferencing - Week 12 Lab

Image
This week, we used georeferencing to assign location information to data and create a new polygon and polyline. Then, we created a buffer to show the protection area for a bald eagle’s nest. The only issue I ran into during this part of the lab was hyperlinking the eagle’s nest image. It was difficult to locate the I drive.  Next, we created a 3D version of the map in ArcSpace, saved it in a 2D format, and opened it in ArcMap to create a different aesthetic. ArcSpace was a very interesting tool and reminded me of Google Maps. I liked that the elevation model behaved like a “sheet” and I feel this program opens up many new possibilities for displaying data.  Section 3:   Buffer Analysis – Hyperlinking Data and Adding Multiple Ring Buffer to a Toolbar 1. First, I located the image EaglesNest.jpg, but I could not find the I:/ drive to paste it to. I looked up information on this drive on the UWF page, but the link provided to paste it to was broken. I dec...

Geocoding - Week 11 Lab

Image
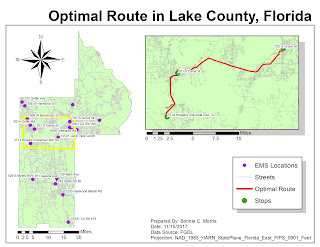
This week geocoded emergency management service sites in Lake County, Florida. By importing data from the US Census Bureau, I was able to network EMS sites with address information. The only problems I encountered during parts 1 and 2 of this weeks lab were with locating addresses that had candidates that didn't match. It was still necessary to use the manual select from the map tool. The third section of the map required me to use a model builder to set certain parameters that locate areas around schools where gas companies regularly check for gas leaks.  I liked this method because it made the steps for creating a map visual. Section 1: Geocoding – Step 4: Research Locations and Match Addresses 1.      I right clicked EMS in the TOC and selected “Geocode Addresses” 2.      I added the MyAddressLocator layer and changed the Minimum match and candidate score 3.      The first method I used t...