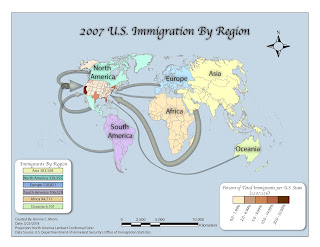
This weeks module covered flow line mapping. Flow maps are used to show movement of people, commodities, ideas, technology, wind, and ocean currents as well as many other phenomena between locations. In this lab, we focused specifically on a distributive flow map that mapped the proportion of immigrants into the United States from different regions of the world using population data from 2007. According to the information given in our textbook, this map most directly aligns to the second subcategory of distributive flow maps. Each flow line is a different size, proportional to the number of immigrants traveling from its respective region. I determined the size of each line by applying a formula to the 2007 data for each region on an excel spreadsheet. Since visual hierarchy and a good figure-ground relationship are extremely important in flow line mapping, I stylized the flow lines with effects like drop shadow, 3D Extrude & Bevel, inner glow, and transparency to make them s...

Comments
Post a Comment